Youngstown State University
College of STEM 2020-2021 Graduation Data
The College of STEM is excited to share results from the second First Destination Survey, sent to Fall 2020, Spring 2021 and Summer 2021 graduates. The first destination survey is used to determine what graduates are doing after they graduate from their institution. The College of STEM First Destination Survey followed the same format, consisting of two parts, the standard NACE (National Association of Colleges & Employers) survey and supplemental questions provided by the College of STEM. The NACE survey focuses specifically on what students do after graduation. The supplemental College of STEM questions take a closer look at goals outlined by academic departments within the College of STEM and the student’s experiences with experiential learning. Students received a free official transcript upon completion of the Survey and graduation from the University as compensation for their time.
The Survey was launched 3 weeks prior to graduation and closed 6 months after graduation. In addition to the students that have submitted responses to the Survey, STEM Careers, Internships & Co-ops compiled data from secondary sources such as LinkedIn. This data pulled from secondary sources is referred to as the knowledge rate. Responses received directly from the student are referred to as the response rate. Because the survey is not mandatory, knowledge rate is still relied upon to gather data on students’ first destinations. The overall rate, the sum of knowledge rate and response rate, for Fall 2020-Summer 2021 graduates was 79.7% or 460 of 577 graduates. The rate is up 5.3% from the 2019-2020 results. Results can be found below.
What did our students do after graduation?
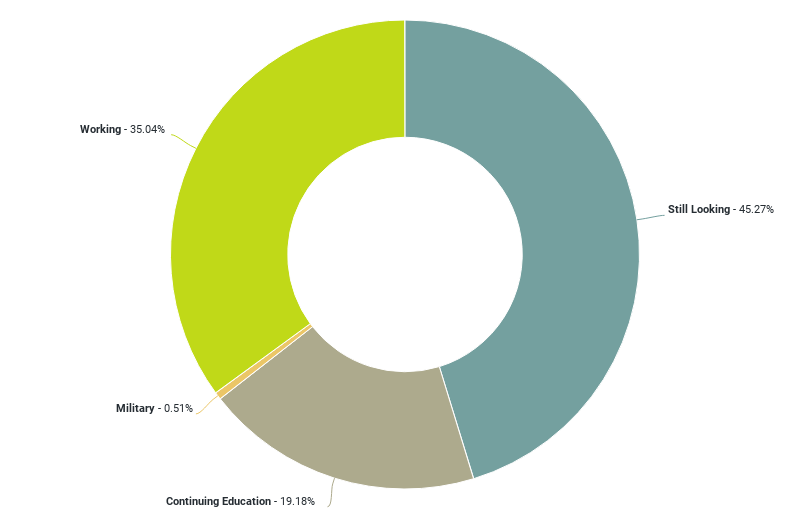
Figure 1. 2020-2021 First Destination for STEM Graduates
It is important to note that students may have found positions since taking the survey or may not have updated information on their LinkedIn. Additionally, graduates are still facing the immediate and long-term effects on the job market caused by COVID-19. This impact may have hindered or prolonged the job search process for many graduates.
Where did our students head to after graduation?
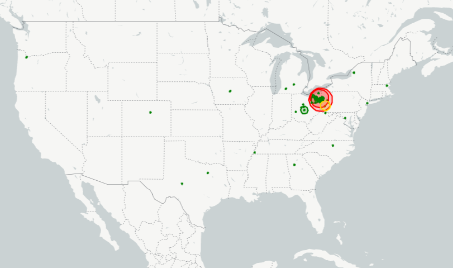
Figure 2. Employment Location Map
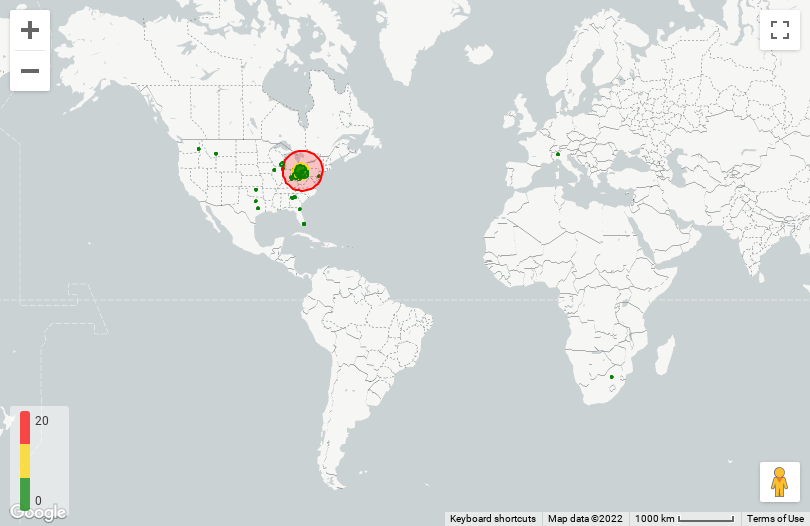
Figure 3. Continuing Education Location Map
What industries are our students working in?
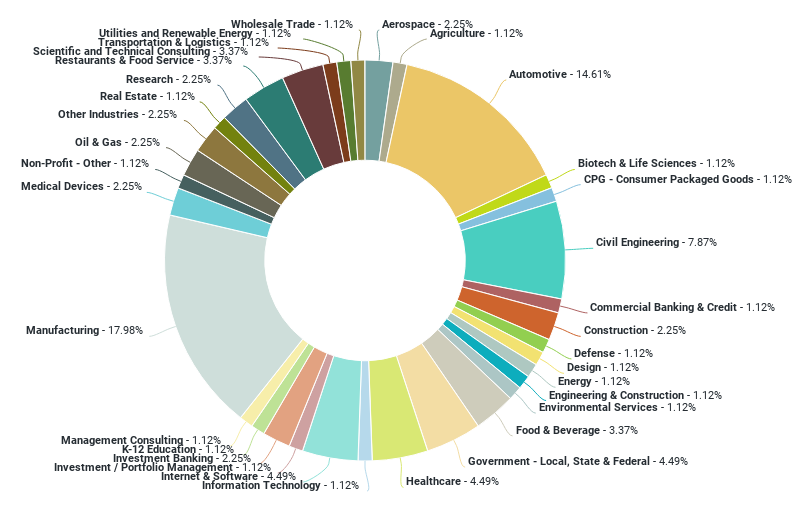
Figure 4. Employment by Industry
Note: 64.96% of data included employer industry.
What types of degree programs are our students moving onto?
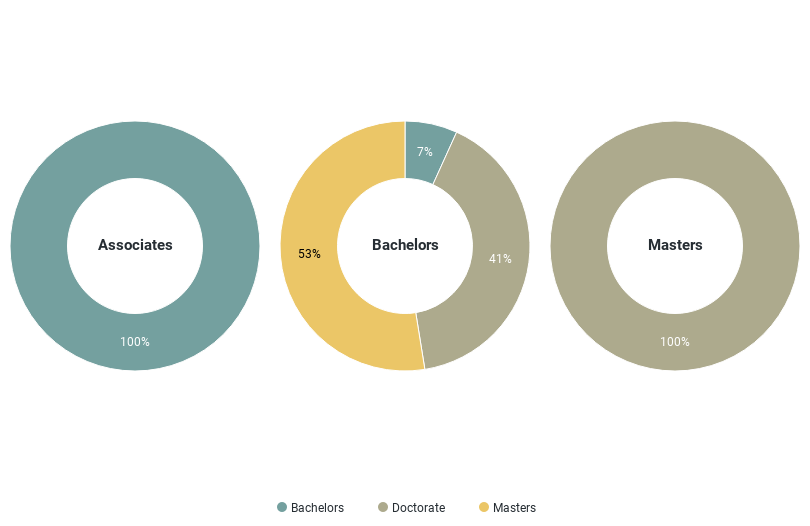
Figure 5. Continuing Education by Degree Type