College of STEM 2019-2020 Graduation Data

2019-2020 First Destination for YSU STEM Graduates
At the conclusion of the Spring 2020 semester, the College of STEM launched its inaugural First Destination Survey to Fall 2019, Spring 2020 and Summer 2020 graduates. A first destination survey is used to determine what graduates are doing after they graduate from their institution. The College of STEM First Destination Survey consists of two parts, the standard NACE (National Association of Colleges & Employers) survey and supplemental questions provided by the College of STEM. The NACE survey focuses specifically on what students do after graduation. The supplemental College of STEM questions take a closer look at goals outlined by academic departments within the College of STEM and the student’s experiences with experiential learning. Students will receive a free official transcript upon completion of the Survey and graduation from the University as compensation for their time.
With the exception of Fall 2019, the Survey launches 2 weeks prior to graduation and closes 6 months after graduation. In addition to the students that have submitted responses to the Survey, STEM Careers, Internships & Co-ops compiled data from secondary sources such as LinkedIn, the First Destination Survey through YSU Career & Academic Advising and faculty members. This data pulled from secondary sources is referred to as the knowledge rate. Responses received directly from the student are referred to as the response rate. Knowledge rate was heavily relied on for Fall 2019 due to the launch of the survey occurring after graduation. The overall rate, the sum of knowledge rate and response rate, for Fall 2019-Summer 2020 graduates was 74.4% or 396 of 532 graduates. Results can be found below.
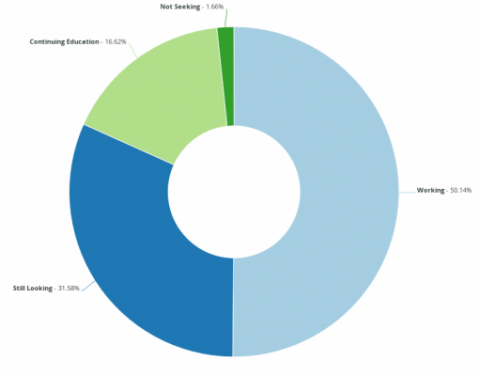
What did our students do after graduation?
See Figure 1, above.
It is important to note that students may have found positions since taking the survey or may not have updated information on their LinkedIn. Additionally, Spring 2020 and Summer 2020 graduates were impacted by the immediate and long-term effects on the job market caused by COVID-19. This impact may have hindered or prolonged the job search process for many graduates.
Where did our students head to after graduation?
The large majority of our students remain in northeast Ohio for employment and in the Midwest United States for continuing education. Click Here to see a graphic representation.
What industries are our students working in?
Manufacturing jobs take up a large piece of our employment pie with 18.75% of graduates heading into that industry. Other sectors include construction (10.42%) and automotive (9.38%) all the way down to defense (4.17%) and investment banking (1.04%). See the full chart by clicking here.
Note: Only 49% of data included employer industry.
What types of degree programs are our students moving onto?
Of our students continuing their education from a bachelors degree: 52% are going on to a doctorate program; 42% to a masters program; and 6% are pursuing another bachelors degree.
Of our graduating masters students, 18% are pursuing another masters degree and 82% are entering a doctorate program.
Click here for a graphic representation.
Did experiential learning impact successful outcomes?
Of our 19-20 graduates who were employed or continuing their education, 59% had completed an experiential learning experience. Of those who indicated they were still looking, 39% had completed an experiential learning experience.
It is important to note that students may have found positions since taking the survey or may not have updated information on LinkedIn. Due to COVID-19, Summer 2020 graduates may have had their experiential learning opportunities canceled or lack of opportunities to apply to.